

Dashboard
The home screen gives you a quick read on your store the moment you sign in.
What this screen is
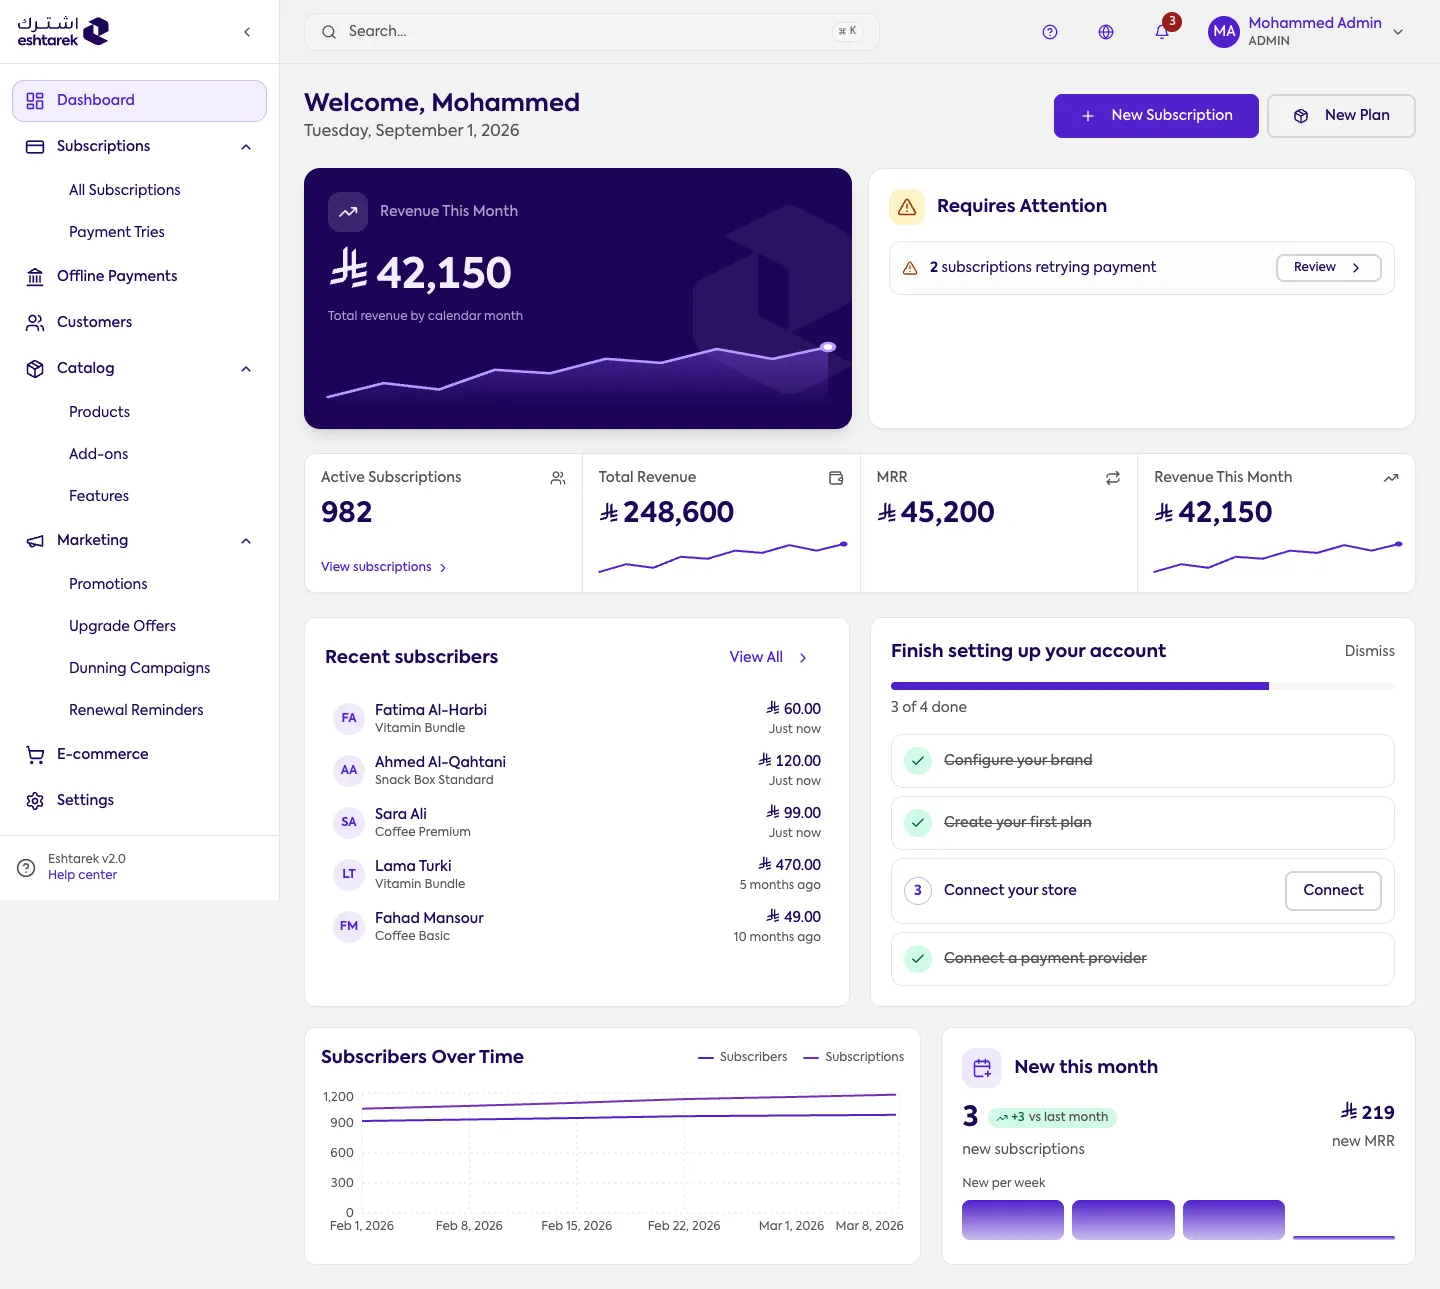
Section titled “What this screen is”An overview of your store’s performance. At the top, a greeting with today’s date and the two actions you take most often: New Subscription and New Plan.
- Needs your attention: anything waiting on you, such as subscriptions being retried. Each alert takes you to the list it concerns.
- Revenue this month: the large card, with your revenue curve across months.
- The headline numbers: revenue this month, monthly revenue, total revenue, and active subscriptions.
- Complete your setup: the setup steps and how far along you are.
- Recent subscribers: who subscribed most recently, for how much, and when.
- New this month: new subscriptions and the monthly revenue they added, against last month.
- Subscribers over time: subscribers and subscriptions as a curve.
What the numbers mean
Section titled “What the numbers mean”- Revenue this month: what has actually been collected since the calendar month began.
- Total revenue: everything collected since your account started.
- Monthly revenue: what recurs each month from active subscriptions only, with every billing cycle normalised to its monthly equivalent. An annual subscription counts as its monthly share. Paused, cancelled and trial subscriptions are excluded.
- Active subscriptions: how many there are now, not how many customers. One customer can hold several.
Complete your setup
Section titled “Complete your setup”Complete your setup shows the basic setup steps and your progress: brand identity, first plan, connecting your store, and connecting a payment provider. Each incomplete step carries a button, and you can hide the list.
If something goes wrong
Section titled “If something goes wrong”- The numbers look empty: they appear after real activity in your store.
- Monthly revenue is lower than you expect: paused and trial subscriptions do not count towards it.